This document covers each panel in the PMPro Hosting admin page, what is shown, and recommended settings.
The admin page is found at PMPro Hosting in the WordPress admin sidebar. It uses a tabbed layout with vertical tabs on the left and the active panel’s content on the right. Settings auto-save when changed.
My Hosting
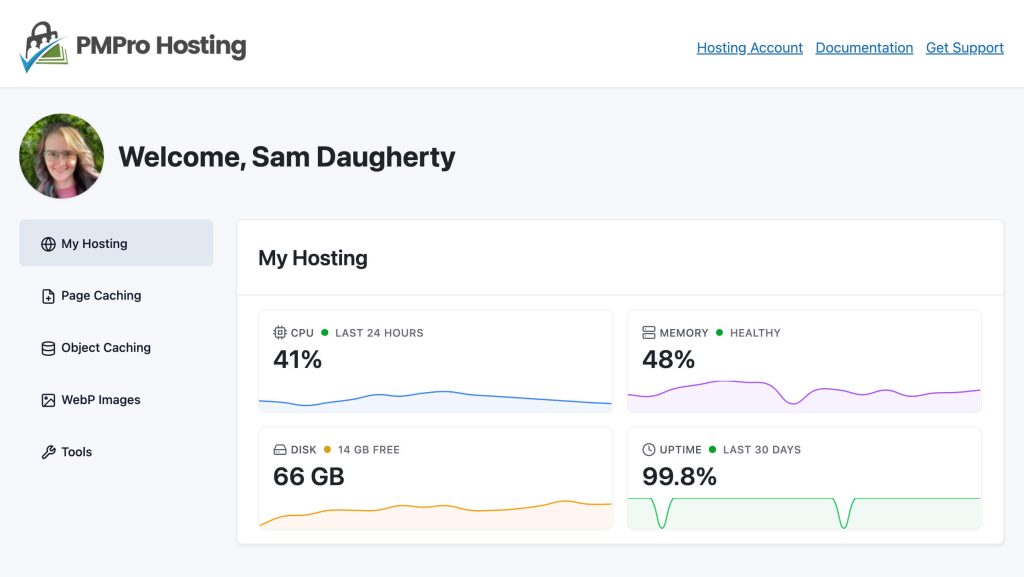
The My Hosting tab is the default landing panel and serves as a dashboard overview. It displays server health metrics in a card layout:
- CPU Usage — Current CPU utilization percentage with a sparkline chart showing recent trends.
- Memory Usage — Current RAM usage with a sparkline chart.
- Disk Usage — Storage consumption with a sparkline chart.
- Uptime — Server uptime with a sparkline chart.
Each card shows the current value alongside historical data (last 24 hours / 30 days).
This panel is display-only — there are no settings to configure here. Use it to monitor your server’s health at a glance.
Page Caching
Page Caching stores static HTML snapshots of pages and serves them to visitors without hitting PHP or the database. This is the biggest single performance gain for most sites.
(more...)Object Caching
Object Caching stores the results of database queries in memory (Redis), so repeated queries return instantly rather than hitting the database. This especially helps logged-in users and dynamic pages that can’t benefit from page caching.
(more...)WebP Images
WebP is a modern image format that produces smaller files than JPEG or PNG, reducing page load times. This section has two toggles and two action buttons.
(more...)Get Support From Our Team of Experts
For more help with this PMPro feature, check out our Support Page with three ways to get support as a free or premium member.
Last updated on March 26, 2026