The Sales and Revenue report gives you valuable insights into the sales volume and revenue generated by your membership business. With this report, you can analyze your data across different time periods and filter the information based on specific criteria.
Here are a few noteworthy features:
- View data based on membership level ID and discount codes used for checkouts
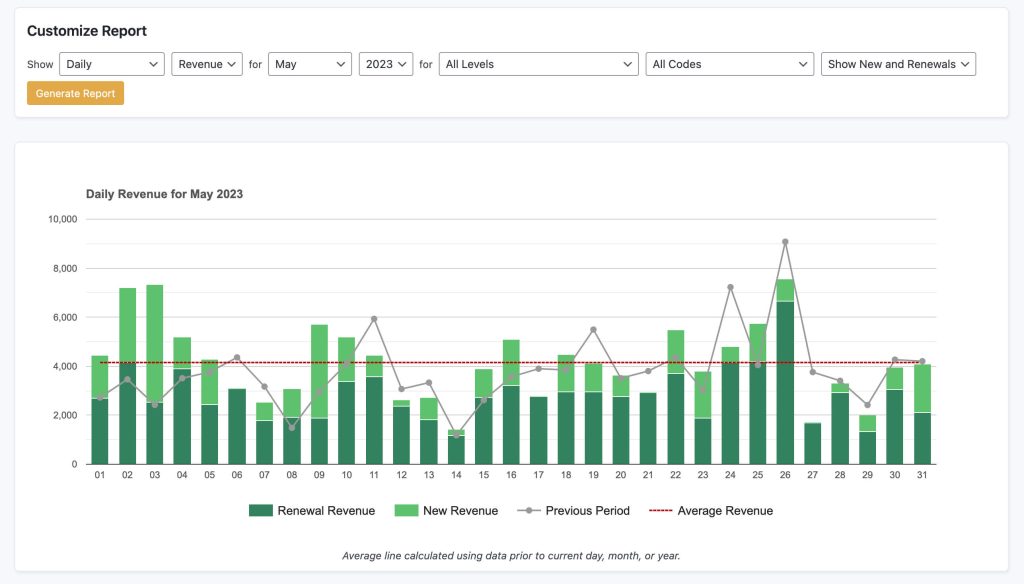
- Interactive charts that separate new and recurring sales or revenue
- Charts include an average line and previous period comparison to provide a benchmark for the report’s data
Sales and Revenue Report Features
- Filter by Time Period: The Sales and Revenue report offers flexible filtering options to view data according to your preferred time intervals. You can choose to filter the report by the following time periods:
- Annually (All Time): This option displays the cumulative sales volume and revenue for all-time data.
- Monthly (Chosen Year): Selecting this option allows you to specify a particular year, and the report will show the sales volume and revenue for each month within that chosen year.
- Daily (Chosen Month): By choosing this option, you can select a specific month, and the report will present the sales volume and revenue for each day within that chosen month.
- Last 7 Days: This filter shows the sales volume and revenue for the most recent 7-day period, providing an up-to-date snapshot of your business performance.
- Last 30 Days: Similar to the previous option, this filter displays the sales volume and revenue for the previous 30 days, enabling you to track trends over a slightly longer period.
- Last 12 Months Running: Selecting this filter allows you to view the sales volume and revenue for the past 12 months, providing a comprehensive overview of your business’s recent performance.
- Custom Range: This filter allows you to select a custom date range, providing flexibility to analyze sales and revenue for any specific period that meets your needs.
- Compare to Previous Period: The Sales and Revenue report also allows you to compare the data with the previous period, which helps you to assess your business’s growth or decline. This comparison feature provides valuable insights into changes in sales volume and revenue, helping you make informed decisions.
- Filter by Membership Level ID: You can further refine the report by filtering the data based on a specific membership level ID. This filter allows you to analyze sales and revenue specific to a particular membership level, providing insights into the performance of different tiers or groups within your customer base.
- Filter by Discount Code: Additionally, you have the option to filter the report based on discount codes used at the checkout. This filter enables you to assess the impact of specific discount codes on your sales and revenue, allowing you to evaluate the effectiveness of different marketing campaigns or promotional strategies.
View Sales and Revenue Data
Within the Sales and Revenue report, you have the option to view different types of sales and revenue data:
- New and Recurring Sales or Revenue: This view displays both new sales or revenue and recurring sales or revenue, allowing you to understand the contribution of both these categories to your overall sales and revenue figures. The interactive charts in the report separate the data for new and recurring sales or revenue in the bar charts, giving you a clear visual representation.
- Only New Sales or Revenue: By selecting this option, the report will focus solely on new sales or revenue, enabling you to analyze the performance of recently acquired customers or clients.
- Only Recurring Sales or Revenue: Choosing this option will show only recurring sales or revenue, giving you insights into the impact that existing customers or clients have on your business.
Charts and Data Table
The Sales and Revenue report includes interactive charts that visually represent the data for easy analysis. When viewing the combined data for new and recurring sales or revenue in the bar charts, the chart will separate the two categories, allowing you to compare their contributions.
The chart will also display an average line, which represents the average sales.
In addition to the charts, a table is now available to display the chart data, providing a detailed numerical view for further analysis.
Get Support From Our Team of Experts
For more help with this PMPro feature, check out our Support Page with three ways to get support as a free or premium member.
Last updated on August 1, 2025